Problem
The biggest concern for high-net-worth individuals and multi-asset investors is the sparsity of data. Their wealth sits across banks, funds, private deals and digital assets. They have to monitor multiple digital systems and evaluate their overall position by themselves.
Nobody had built them a single place to answer the simplest question: what am I worth right now, and where is it?
Context
The population of high-net-worth individuals is growing fast in the UAE. Access Wealth is a wealth and investment platform built for them. The goal of this part of the product was a wealth snapshot: a dashboard that lets users quickly and efficiently oversee wealth spread across various asset classes.
I owned research, information architecture, UX design and data visualisation.
What I did
I started with user interviews to understand how these investors actually manage their wealth today. Four investors, from crypto, venture capital, private equity and a family office, described the same pain from different angles:
- "It is hard to aggregate information from multiple institutions & asset classes." — crypto investor
- "Too busy to concentrate on personal wealth." — private-equity investor
- "One should be able to have access to data in a click of a button." — family-office investor
- "With time data has changed and there are many line items which makes it difficult to track net-worth." — VC investor
Those four quotes became the brief. Aggregation, time, one-click access and too many line items.
From there I worked on the information architecture: what belongs on the overview, what belongs one level down, and how cash, public markets, open-ended alternatives and liquid alternatives sit next to each other without turning into a spreadsheet.
Solution
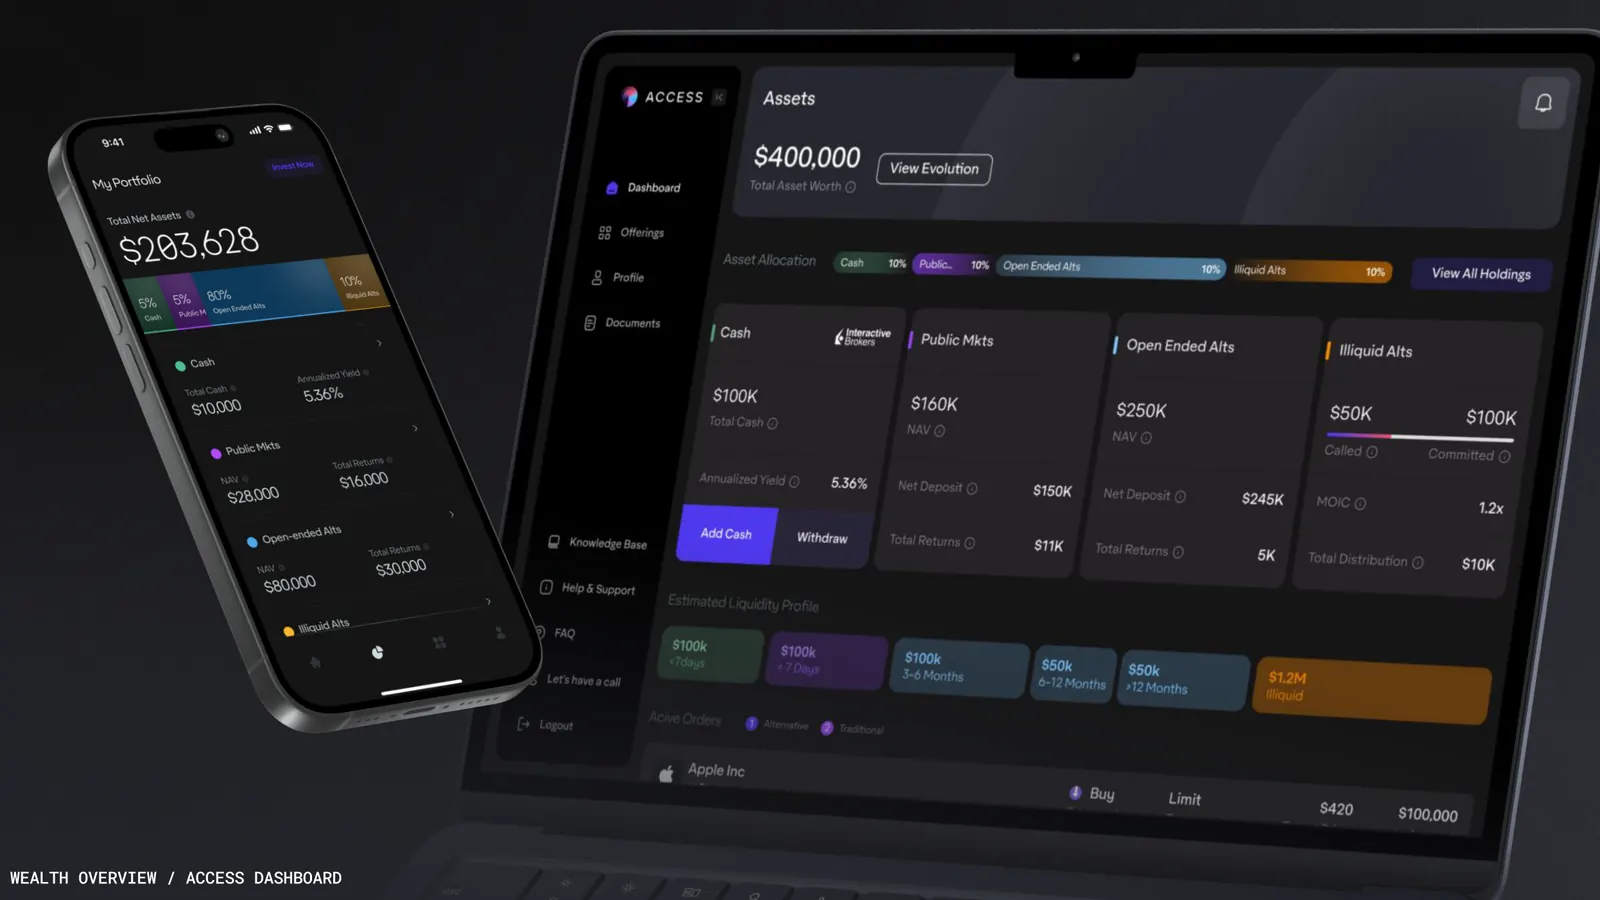
Wealth Overview brings everything onto one single dashboard.
- Total asset worth up front. One number, then the allocation bar that shows how it splits across asset classes.
- One card per asset class. Cash, public markets, open-ended alternatives and liquid alternatives each get their own card with value, NAV and the key figures that matter for that class.
- Multiple modes of presentation. The same data can be viewed in more than one way, so users make the most out of it instead of exporting it somewhere else.
- Built for desktop and mobile. The full dashboard on desktop, the same snapshot condensed on the phone.
Why it worked / what I'd do next
The research made the structure obvious. Every quote pointed at the same thing: the data existed, it was just scattered. So the design job was not to add more data, it was to aggregate it and choose what to show first.
Next, I would want to test the presentation modes with the same four investor types and see which one they default to. That answer should decide the landing view.